ZigZagの軌跡から値動きの特性を確認する方法【MQLプログラミングの基礎】
1.ZigZagをチャートにセットして新規ファイルを作成
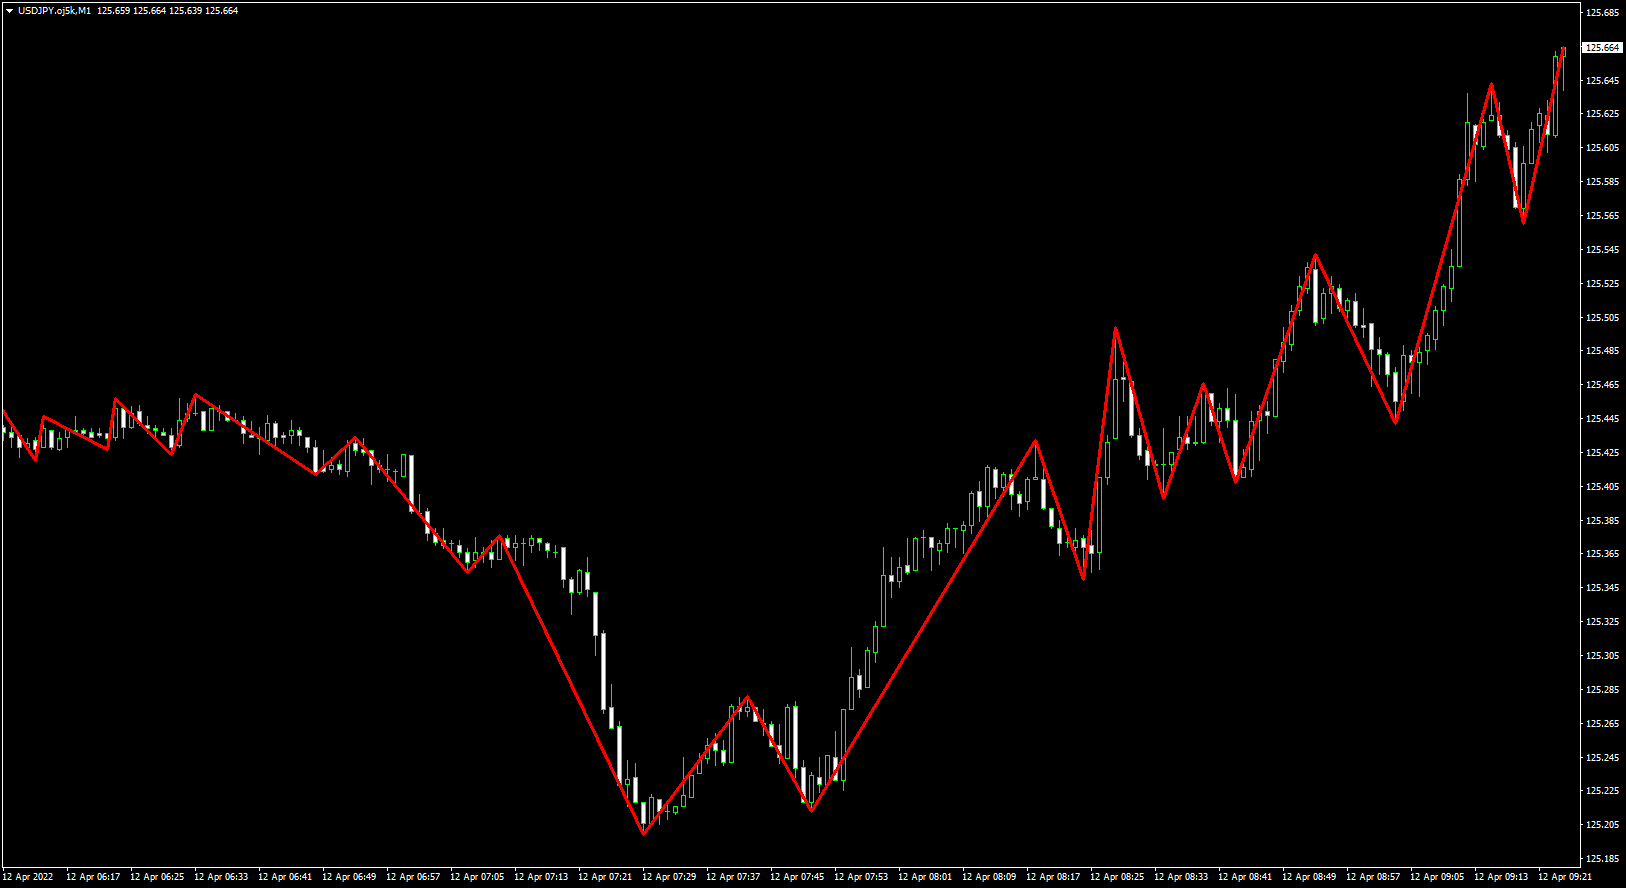
この記事では、ZigZagの軌跡から値動きの特性を確認する方法を紹介します。ZigZagは特定の高値と安値を直線で結んだインジケーターで、MT4に標準搭載されています。相場の大きな流れを視覚的に把握できることから、利用する人も多いです。
まずチャートにZigZagをセットしましょう。ここでは見やすいように線の幅を「3」に変えて太くし、頂点を多く調査したいので山谷が増えるようにパラメーターのDepthの値を「5」に変更しています。今回は、このZigZagの頂点の情報を軌跡として残していくツールを作成します。
ファイルのひな形を作りましょう。ファイルの新規作成で「カスタムインディケータ」を選択し、ファイル名を「ZigZagPoint」とします。パラメーターは標準搭載されているZigZagに合わせて三つ設定しておきます。一つ目は名前を「Depth」、初期値を「5」、二つ目は名前を「Deviation」、初期値を「5」、三つ目は名前を「Backstep」、初期値を「3」とします。

「カスタムインディケータのイベントハンドラ」の画面では、「OnTimer」「OnChartEvent」のどちらにもチェックを入れずに次へ進み、「完了」をクリックすれば、ひな形の完成です。
2.ZigZagの頂点を二つ見つける
ZigZagの先端の最新ポイントと、一つ前のポイントが、どのような軌跡を描くかを表示さます。まずは調査するZigZagの値を読み取れるように、iCustom関数を利用します。OnCalculate関数内に次のコードを記述しましょう。通貨ペアと時間足はチャートに表示中のもの、名前は「ZigZag」、入力パラメーターは先程設定した「Depth」「Deviation」「Backstep」を割り当て、バッファーの番号は一つだけなので「0」とします。これでZigZagのデータが取得できます。
for (int i = 0; i < Bars -1; i++) {
   double zz = iCustom(NULL, 0, "ZigZag", Depth, Deviation, Backstep, 0, i);
}
取得するのは最初のポイントと二つ目のポイントだけで良いので、頂点が見つかった場合にカウントを一つ進め、カウントが「2」以上になったらそこでfor文のループを抜けるようにします。一番最初の足から順に過去にさかのぼって検索し、頂点が二つ見つかったところで検索終了です。
int count = 0;
for (int i = 0; i < Bars -1; i++) {
   double zz = iCustom(NULL, 0, "ZigZag", Depth, Deviation, Backstep, 0, i);
   if (zz != 0) {
      count++;
   }
   if (count >= 2) break;
}
3.Textオブジェクトを設定
上記では、ZigZagをチャートにセットして、最新ポイントと一つ前のポイントの二点を検索するところまで解説しました。続いて、見つけた二つの頂点にTextオブジェクトを表示させます。
Textオブジェクトのサンプルコードは、MQL4リファレンスからコピーして使いましょう。MQL4リファレンスの目次にある「Constants, Enumerations and Structures」→「Objects Constants」→「Object Types」をクリックするとオブジェクトの一覧が表示されるので、その中から「OBJ_TEXT」を選択し、あらかじめ用意されている「Creating Text object」のコードをコピーしてファイル下部に貼り付けます。
まず初期設定を変更しましょう。頂点の真ん中にTextオブジェクトを表示したいので、「// anchor type」の「anchor=ANCHOR_LEFT_UPPER」を「anchor=ANCHOR_CENTER」にします。今回は〇や×の記号を使うので、「// font」の「font="Arial"」を「font="メイリオ"」に変更して日本語フォントにします。また、「// font size」の「font_size=10」を「font_size=16」に変え、テキストの色を指定できるように「// color」の一行を「// the text itself」の下に移動しましょう。
そして不要な部分も消しておきます。「//--- set anchor point coordinates if they are not set」から「ResetLastError();」までの4行と、「Print(__FUNCTION__,」「": failed to create \"Text\" object! Error code = ",GetLastError());」の2行を削除してください。さらに価格のデータを反映していくようにしたいので、「return(false);」の上に「ObjectSetDouble(chart_ID, name, OBJPROP_PRICE, 0, price);」を加えます。これを入れないと一度作ったオブジェクトだった場合、すぐに処理が終了してしまうので注意が必要です。これでTextオブジェクトの設定ができました。
//+------------------------------------------------------------------+
//| Creating Text object                                             |
//+------------------------------------------------------------------+
bool TextCreate(const long              chart_ID = 0,             // chart's ID
                const string            name = "Text",            // object name
                const int               sub_window = 0,           // subwindow index
                datetime                time = 0,                 // anchor point time
                double                  price = 0,                // anchor point price
                const string            text = "Text",            // the text itself
                const color             clr = clrRed,             // color
                const string            font = "メイリオ",           // font
                const int               font_size = 16,           // font size
                const double            angle = 0.0,              // text slope
                const ENUM_ANCHOR_POINT anchor = ANCHOR_CENTER, // anchor type
                const bool              back = false,             // in the background
                const bool              selection = false,        // highlight to move
                const bool              hidden = true,            // hidden in the object list
                const long              z_order = 0)              // priority for mouse click
{
//--- create Text object
   if(!ObjectCreate(chart_ID, name, OBJ_TEXT, sub_window, time, price)) {
      ObjectSetDouble(chart_ID, name, OBJPROP_PRICE, 0, price);
      return(false);
   }
//--- set the text
   ObjectSetString(chart_ID, name, OBJPROP_TEXT, text);
//--- set text font
   ObjectSetString(chart_ID, name, OBJPROP_FONT, font);
//--- set font size
   ObjectSetInteger(chart_ID, name, OBJPROP_FONTSIZE, font_size);
//--- set the slope angle of the text
   ObjectSetDouble(chart_ID, name, OBJPROP_ANGLE, angle);
//--- set anchor type
   ObjectSetInteger(chart_ID, name, OBJPROP_ANCHOR, anchor);
//--- set color
   ObjectSetInteger(chart_ID, name, OBJPROP_COLOR, clr);
//--- display in the foreground (false) or background (true)
   ObjectSetInteger(chart_ID, name, OBJPROP_BACK, back);
//--- enable (true) or disable (false) the mode of moving the object by mouse
   ObjectSetInteger(chart_ID, name, OBJPROP_SELECTABLE, selection);
   ObjectSetInteger(chart_ID, name, OBJPROP_SELECTED, selection);
//--- hide (true) or display (false) graphical object name in the object list
   ObjectSetInteger(chart_ID, name, OBJPROP_HIDDEN, hidden);
//--- set the priority for receiving the event of a mouse click in the chart
   ObjectSetInteger(chart_ID, name, OBJPROP_ZORDER, z_order);
//--- successful execution
   return(true);
}
4.Textオブジェクトで「×」と「〇」を表示
設定したTextCreateを使って、Textオブジェクトを表示させましょう。まず、オブジェクトをまとめて削除できるようにしたいので、ファイル上部のプロパティ「property indicator_chart_window」の下に接頭辞として「PREFIX」を定義します。
#define PREFIX "ZigZagPoint_"
そして、「Custom indicator initialization function」の下に「Custom indicator deinitialization function」を設けて、OnDeinit関数を用いた次のコードを記述します。これでインジケーターをチャートから外したときに、オブジェクトが消えるようになります。
void OnDeinit(const int reason)
{
   ObjectsDeleteAll(0, PREFIX);
}
Textオブジェクトを表示するためのTextCreateは、OnCalculate関数内の「count++;」の下で定義しましょう。一つの足に一つのオブジェクトだけにしたいので、「TimeToString」で足の時間の情報を名前に利用します。また、表示するテキストは別で定義し、一つ目のポイントだった場合は「×」、二つ目のポイントだった場合は「〇」とします。色は×を白、〇をオレンジにしましょう。
string name = PREFIX + (string)i + "_" + TimeToString(Time[i], TIME_DATE | TIME_MINUTES);
string text = count == 1 ? "✕" : "〇";
color clr = count == 1 ? clrWhite : clrOrange;
TextCreate(0, name, 0, Time[i], zz, text, clr);
これでコンパイルしてZigZagを表示したチャートにセットすると、ZigZagの先端の最新ポイントに白の「×」が、その次のポイントにオレンジの「〇」が描かれることが分かります。ラインがリペイントして変化しても、〇×表示が軌跡として残る為、ZigZagライン変化の特性を確認することができます。

5.一定の時間経過でオブジェクトを削除する
上記では、ZigZagの最新ポイントに白の「×」を、その一つ前のポイントにオレンジの「〇」を表示することができました。ただ、現状ではチャートをそのままにしていると無限にTextオブジェクトが表示されてしまうので、一定の時間が経過したら消すようにしましょう。

やり方としては、for文を使って全オブジェクトの名前を確認しながら検索し、名前の中に接頭辞の「PREFIX」が含まれていたら、そのときの時間情報を取得します。時間情報が分かればオブジェクトの位置の足の番号が出せるので、それを利用するのがポイントです。今回は足の番号が「1000」より大きかった場合にオブジェクトを消すようにしましょう。これでオブジェクトが無限にたまることを回避できます。
for (int i = ObjectsTotal(0, -1) - 1; i >= 0; i--) {
   string name = ObjectName(0, i);
   if (StringFind(name, PREFIX) != -1) {
      datetime timeText = (datetime)ObjectGetInteger(0, name, OBJPROP_TIME, 0);
      if (iBarShift(NULL, 0, timeText) > 1000) ObjectDelete(0, name);
   }
}
6.ソースコード
今回、作成したソースコードは下記の通りです。
//+------------------------------------------------------------------+
//|                                                  ZigZagPoint.mq4 |
//|                        Copyright 2022, MetaQuotes Software Corp. |
//|                                             https://www.mql5.com |
//+------------------------------------------------------------------+
#property copyright "Copyright 2022, MetaQuotes Software Corp."
#property link      "https://www.mql5.com"
#property version   "1.00"
#property strict
#property indicator_chart_window
#define PREFIX "ZigZagPoint_"
//--- input parameters
input int      Depth = 5;
input int      Deviation = 5;
input int      Backstep = 3;
//+------------------------------------------------------------------+
//| Custom indicator initialization function                         |
//+------------------------------------------------------------------+
int OnInit()
{
//--- indicator buffers mapping

//---
   return(INIT_SUCCEEDED);
}
//+------------------------------------------------------------------+
//| Custom indicator deinitialization function                         |
//+------------------------------------------------------------------+
void OnDeinit(const int reason)
{
   ObjectsDeleteAll(0, PREFIX);
}
//+------------------------------------------------------------------+
//| Custom indicator iteration function                              |
//+------------------------------------------------------------------+
int OnCalculate(const int rates_total,
                const int prev_calculated,
                const datetime &time[],
                const double &open[],
                const double &high[],
                const double &low[],
                const double &close[],
                const long &tick_volume[],
                const long &volume[],
                const int &spread[])
{
//---
   int count = 0;

   for (int i = 0; i < Bars - 1; i++) {
      double zz = iCustom(NULL, 0, "ZigZag", Depth, Deviation, Backstep, 0, i);

      if (zz != 0) {
         count++;
         string name = PREFIX + (string)i + "_" + TimeToString(Time[i], TIME_DATE | TIME_MINUTES);
         string text = count == 1 ? "×" : "〇";
         color clr = count == 1 ? clrWhite : clrOrange;

         TextCreate(0, name, 0, Time[i], zz, text, clr);
      }
      if (count >= 2) break;
   }
   for (int i = ObjectsTotal(0, -1) - 1; i >= 0; i--) {
      string name = ObjectName(0, i);
      if (StringFind(name, PREFIX) != -1) {
         datetime timeText = (datetime)ObjectGetInteger(0, name, OBJPROP_TIME, 0);
         if (iBarShift(NULL, 0, timeText) > 1000) ObjectDelete(0, name);
      }
   }
//--- return value of prev_calculated for next call
   return(rates_total);
}
//+------------------------------------------------------------------+
//| Creating Text object                                             |
//+------------------------------------------------------------------+
bool TextCreate(const long              chart_ID = 0,             // chart's ID
                const string            name = "Text",            // object name
                const int               sub_window = 0,           // subwindow index
                datetime                time = 0,                 // anchor point time
                double                  price = 0,                // anchor point price
                const string            text = "Text",            // the text itself
                const color             clr = clrRed,             // color
                const string            font = "メイリオ",           // font
                const int               font_size = 16,           // font size
                const double            angle = 0.0,              // text slope
                const ENUM_ANCHOR_POINT anchor = ANCHOR_CENTER, // anchor type
                const bool              back = false,             // in the background
                const bool              selection = false,        // highlight to move
                const bool              hidden = true,            // hidden in the object list
                const long              z_order = 0)              // priority for mouse click
{
//--- create Text object
   if(!ObjectCreate(chart_ID, name, OBJ_TEXT, sub_window, time, price)) {
      ObjectSetDouble(chart_ID, name, OBJPROP_PRICE, 0, price);
      return(false);
   }
//--- set the text
   ObjectSetString(chart_ID, name, OBJPROP_TEXT, text);
//--- set text font
   ObjectSetString(chart_ID, name, OBJPROP_FONT, font);
//--- set font size
   ObjectSetInteger(chart_ID, name, OBJPROP_FONTSIZE, font_size);
//--- set the slope angle of the text
   ObjectSetDouble(chart_ID, name, OBJPROP_ANGLE, angle);
//--- set anchor type
   ObjectSetInteger(chart_ID, name, OBJPROP_ANCHOR, anchor);
//--- set color
   ObjectSetInteger(chart_ID, name, OBJPROP_COLOR, clr);
//--- display in the foreground (false) or background (true)
   ObjectSetInteger(chart_ID, name, OBJPROP_BACK, back);
//--- enable (true) or disable (false) the mode of moving the object by mouse
   ObjectSetInteger(chart_ID, name, OBJPROP_SELECTABLE, selection);
   ObjectSetInteger(chart_ID, name, OBJPROP_SELECTED, selection);
//--- hide (true) or display (false) graphical object name in the object list
   ObjectSetInteger(chart_ID, name, OBJPROP_HIDDEN, hidden);
//--- set the priority for receiving the event of a mouse click in the chart
   ObjectSetInteger(chart_ID, name, OBJPROP_ZORDER, z_order);
//--- successful execution
   return(true);
}
本記事の監修者・HT FX
2013年にFXを開始し、その後専業トレーダーへ。2014年からMT4/MT5のカスタムインジケーターの開発に取り組む。ブログでは100本を超えるインジケーターを無料公開。投資スタイルは自作の秒足インジケーターを利用したスキャルピング。
EA(自動売買)を学びたい方へオススメコンテンツ

OANDAではEA(自動売買)を稼働するプラットフォームMT4/MT5の基本的な使い方について、画像や動画付きで詳しく解説しています。MT4/MT5のインストールからEAの設定方法までを詳しく解説しているので、初心者の方でもスムーズにEA運用を始めることが可能です。またOANDAの口座をお持ちであれば、独自開発したオリジナルインジケーターを無料で利用することもできます。EA運用をお考えであれば、ぜひ口座開設をご検討ください。
本ホームページに掲載されている事項は、投資判断の参考となる情報の提供を目的としたものであり、投資の勧誘を目的としたものではありません。投資方針、投資タイミング等は、ご自身の責任において判断してください。本サービスの情報に基づいて行った取引のいかなる損失についても、当社は一切の責を負いかねますのでご了承ください。また、当社は、当該情報の正確性および完全性を保証または約束するものでなく、今後、予告なしに内容を変更または廃止する場合があります。なお、当該情報の欠落・誤謬等につきましてもその責を負いかねますのでご了承ください。