トレンドラインを複数のチャートで同期させる方法
オブジェクトの新規作成と削除を検知
この記事では、トレンドラインを複数のチャートで同期させる方法を紹介します。具体的には、当該インジケーターをセットしたチャートでトレンドラインを新規作成すると、他のチャートにも同じものが描画されるようにします。
まずはファイルの新規作成で「カスタムインディケータ」を選択し、ファイル名を「TrendlineSync」とします。パラメーターは追加せず次へ進み、「カスタムインディケータのイベントハンドラ」の画面で「OnChartEvent」にチェックを入れ、そのまま「完了」をクリックすれば、ひな形の完成です。

トレンドラインが新規作成されたときに同期をさせたいので、OnInit関数の配下にチャートのプロパティを設定するChartSetInteger関数で「CHART_EVENT_OBJECT_CREATE」を宣言しておく必要があります。また、トレンドラインが削除されたのを検知するために「CHART_EVENT_OBJECT_DELETE」もセットしておきます。
ChartSetInteger(0, CHART_EVENT_OBJECT_CREATE, true);
ChartSetInteger(0, CHART_EVENT_OBJECT_DELETE, true);
「OBJ_TREND」のサンプルコードをコピーして使う
続いてOnChartEvent関数の配下に、チャートにイベントが発生した際の処理をif文で記述します。まずは「CHART_EVENT_OBJECT_CREATE」についてです。もし新規で作成されたオブジェクトがトレンドラインだったときに、そのトレンドラインの情報を取得して同期させます。
if (id == CHARTEVENT_OBJECT_CREATE) {
      if (ObjectGetInteger(0, sparam, OBJPROP_TYPE) == OBJ_TREND) {
      }
}
このif文にトレンドラインに関するコードを追記します。MQL4リファレンスからサンプルコードをコピーして使いましょう。MQL4リファレンスの目次にある「Constants, Enumerations and Structures」→「Objects Constants」→「Object Types」をクリックするとオブジェクトの一覧が表示されるので、その中から「OBJ_TREND」を選択し、あらかじめ用意されている下記コードをコピーして貼り付けます。
//+------------------------------------------------------------------+
//| Create a trend line by the given coordinates                     |
//+------------------------------------------------------------------+
bool TrendCreate(const long            chart_ID=0,        // chart's ID
                 const string          name="TrendLine",  // line name
                 const int             sub_window=0,      // subwindow index
                 datetime              time1=0,           // first point time
                 double                price1=0,          // first point price
                 datetime              time2=0,           // second point time
                 double                price2=0,          // second point price
                 const color           clr=clrRed,        // line color
                 const ENUM_LINE_STYLE style=STYLE_SOLID, // line style
                 const int             width=1,           // line width
                 const bool            back=false,        // in the background
                 const bool            selection=true,    // highlight to move
                 const bool            ray_right=false,   // line's continuation to the right
                 const bool            hidden=true,       // hidden in the object list
                 const long            z_order=0)         // priority for mouse click
  {
//--- set anchor points' coordinates if they are not set
   ChangeTrendEmptyPoints(time1,price1,time2,price2);
//--- reset the error value
   ResetLastError();
//--- create a trend line by the given coordinates
   if(!ObjectCreate(chart_ID,name,OBJ_TREND,sub_window,time1,price1,time2,price2))
     {
      Print(__FUNCTION__,
            ": failed to create a trend line! Error code = ",GetLastError());
      return(false);
     }
//--- set line color
   ObjectSetInteger(chart_ID,name,OBJPROP_COLOR,clr);
//--- set line display style
   ObjectSetInteger(chart_ID,name,OBJPROP_STYLE,style);
//--- set line width
   ObjectSetInteger(chart_ID,name,OBJPROP_WIDTH,width);
//--- display in the foreground (false) or background (true)
   ObjectSetInteger(chart_ID,name,OBJPROP_BACK,back);
//--- enable (true) or disable (false) the mode of moving the line by mouse
//--- when creating a graphical object using ObjectCreate function, the object cannot be
//--- highlighted and moved by default. Inside this method, selection parameter
//--- is true by default making it possible to highlight and move the object
   ObjectSetInteger(chart_ID,name,OBJPROP_SELECTABLE,selection);
   ObjectSetInteger(chart_ID,name,OBJPROP_SELECTED,selection);
//--- enable (true) or disable (false) the mode of continuation of the line's display to the right
   ObjectSetInteger(chart_ID,name,OBJPROP_RAY_RIGHT,ray_right);
//--- hide (true) or display (false) graphical object name in the object list
   ObjectSetInteger(chart_ID,name,OBJPROP_HIDDEN,hidden);
//--- set the priority for receiving the event of a mouse click in the chart
   ObjectSetInteger(chart_ID,name,OBJPROP_ZORDER,z_order);
//--- successful execution
   return(true);
  }
コピーしたら、次の9行は不要なので削除します。
const bool            selection=true,    // highlight to move
//--- set anchor points' coordinates if they are not set
ChangeTrendEmptyPoints(time1,price1,time2,price2);
//--- reset the error value
ResetLastError();
Print(__FUNCTION__,
": failed to create a trend line! Error code = ",GetLastError());
ObjectSetInteger(chart_ID,name,OBJPROP_SELECTABLE,selection);
ObjectSetInteger(chart_ID,name,OBJPROP_SELECTED,selection);
そして「hidden = true」を「hidden = false」に、2か所ある「ray_right」を「ray」に、「OBJPROP_RAY_RIGHT」を「OBJPROP_RAY」に変更します。これでトレンドラインに関するサンプルコードの準備は完了です。ちなみに「OBJPROP_RAY_RIGHT」は、MT5用の指示です。
//+------------------------------------------------------------------+
//| Create a trend line by the given coordinates                     |
//+------------------------------------------------------------------+
bool TrendCreate(const long            chart_ID=0,        // chart's ID
                 const string          name="TrendLine",  // line name
                 const int             sub_window=0,      // subwindow index
                 datetime              time1=0,           // first point time
                 double                price1=0,          // first point price
                 datetime              time2=0,           // second point time
                 double                price2=0,          // second point price
                 const color           clr=clrRed,        // line color
                 const ENUM_LINE_STYLE style=STYLE_SOLID, // line style
                 const int             width=1,           // line width
                 const bool            back=false,        // in the background
                 const bool            ray=false,   // line's continuation to the right
                 const bool            hidden=false,       // hidden in the object list
                 const long            z_order=0)         // priority for mouse click
  {
//--- create a trend line by the given coordinates
   if(!ObjectCreate(chart_ID,name,OBJ_TREND,sub_window,time1,price1,time2,price2))
     {
      return(false);
     }
//--- set line color
   ObjectSetInteger(chart_ID,name,OBJPROP_COLOR,clr);
//--- set line display style
   ObjectSetInteger(chart_ID,name,OBJPROP_STYLE,style);
//--- set line width
   ObjectSetInteger(chart_ID,name,OBJPROP_WIDTH,width);
//--- display in the foreground (false) or background (true)
   ObjectSetInteger(chart_ID,name,OBJPROP_BACK,back);
//--- enable (true) or disable (false) the mode of moving the line by mouse
//--- when creating a graphical object using ObjectCreate function, the object cannot be
//--- highlighted and moved by default. Inside this method, selection parameter
//--- is true by default making it possible to highlight and move the object
//--- enable (true) or disable (false) the mode of continuation of the line's display to the right
   ObjectSetInteger(chart_ID,name,OBJPROP_RAY,ray);
//--- hide (true) or display (false) graphical object name in the object list
   ObjectSetInteger(chart_ID,name,OBJPROP_HIDDEN,hidden);
//--- set the priority for receiving the event of a mouse click in the chart
   ObjectSetInteger(chart_ID,name,OBJPROP_ZORDER,z_order);
//--- successful execution
   return(true);
  }
トレンドラインの時間情報や価格情報などを取得
続いてそのコードを、トレンドラインの情報を取得して同期させるように改修します。まず、準備したトレンドラインに関するコードの「ObjectSetInteger(chart_ID,name,OBJPROP_COLOR,clr);」から下13行をコピーして、if文のところに貼り付けます。
if (id == CHARTEVENT_OBJECT_CREATE) {
   if (ObjectGetInteger(0, sparam, OBJPROP_TYPE) == OBJ_TREND) {
   ObjectSetInteger(chart_ID,name,OBJPROP_COLOR,clr);
//--- set line display style
   ObjectSetInteger(chart_ID,name,OBJPROP_STYLE,style);
//--- set line width
   ObjectSetInteger(chart_ID,name,OBJPROP_WIDTH,width);
//--- display in the foreground (false) or background (true)
   ObjectSetInteger(chart_ID,name,OBJPROP_BACK,back);
//--- enable (true) or disable (false) the mode of moving the line by mouse
//--- when creating a graphical object using ObjectCreate function, the object cannot be
//--- highlighted and moved by default. Inside this method, selection parameter
//--- is true by default making it possible to highlight and move the object
//--- enable (true) or disable (false) the mode of continuation of the line's display to the right
   ObjectSetInteger(chart_ID,name,OBJPROP_RAY,ray);
   }
}
そして、この部分のコードを次のように書き換えます。トレンドラインの状態を取得したいので「ObjectSetInteger」は全て「ObjectGetInteger」に変更し、「OBJPROP_TIME」を設定して時間情報を、「OBJPROP_PRICE」を設定して価格情報を取得するようにします。
if (id == CHARTEVENT_OBJECT_CREATE) {
   if (ObjectGetInteger(0, sparam, OBJPROP_TYPE) == OBJ_TREND) {
      datetime time0 = (datetime)ObjectGetInteger(0, sparam, OBJPROP_TIME, 0);
      datetime time1 = (datetime)ObjectGetInteger(0, sparam, OBJPROP_TIME, 1);
      double price0 = ObjectGetDouble(0, sparam, OBJPROP_PRICE, 0);
      double price1 = ObjectGetDouble(0, sparam, OBJPROP_PRICE, 1);
      color clr = (color)ObjectGetInteger(0, sparam, OBJPROP_COLOR);
      ENUM_LINE_STYLE style = (ENUM_LINE_STYLE)ObjectGetInteger(0, sparam, OBJPROP_STYLE);
      int width = (int)ObjectGetInteger(0, sparam, OBJPROP_WIDTH);
      bool back = ObjectGetInteger(0, sparam, OBJPROP_BACK);
      bool ray = ObjectGetInteger(0, sparam, OBJPROP_RAY);
   }
}
得た情報を各チャートに同期
次に、得たトレンドラインの情報を各チャートに同期させて表示するようにします。同期のプログラムに関しては、「複数チャートを同期させる」という記事で作ったものを流用します。MQL4リファレンスの目次にある「Chart Operations」→「ChartNext」をクリックすると表示されるページにも、全チャートに対して処理を実行する参考例があるので、そちらを利用しても構いません。
long chart_id = ChartFirst();
   while (true) {
      if (chart_id != ChartID()) {
         if (ChartGetInteger(chart_id, CHART_SCALE) != scale) {
            ChartSetInteger(chart_id, CHART_SCALE, scale);
         }
         ChartRedraw(chart_id);
      }

      chart_id = ChartNext(chart_id);
      if (chart_id < 0) break;
   }
上記コードはチャートのスケールを同期させるものなので、トレンドラインを同期させるものに置き換えましょう。まずスケールに関する「if (ChartGetInteger(chart_id, CHART_SCALE) != scale) {」「ChartSetInteger(chart_id, CHART_SCALE, scale);」の2行は不要なので削除します。
今回はチャートの一つ目から順番に情報を取得し、一つ進むたびに「ChartNext」で次のチャートに切り替えていきます。元となるチャートではなかったときと、元となるチャートと同じ通貨ペアのときだけ処理を実行するようにしたいので、一つ目のif文を修正します。そして、同じ名前のオブジェクトがなかった場合に、トレンドラインを作るようにします。
long chart_id = ChartFirst();
while (true) {
   if (chart_id != ChartID() && ChartSymbol(chart_id) == _Symbol) {
      if (ObjectFind(chart_id, sparam) == -1)
         TrendCreate(chart_id, sparam, 0, time0, price0, time1, price1, clr, style, width, back, ray);
      ChartRedraw(chart_id);
      }
      chart_id = ChartNext(chart_id);
      if (chart_id < 0) break;
}
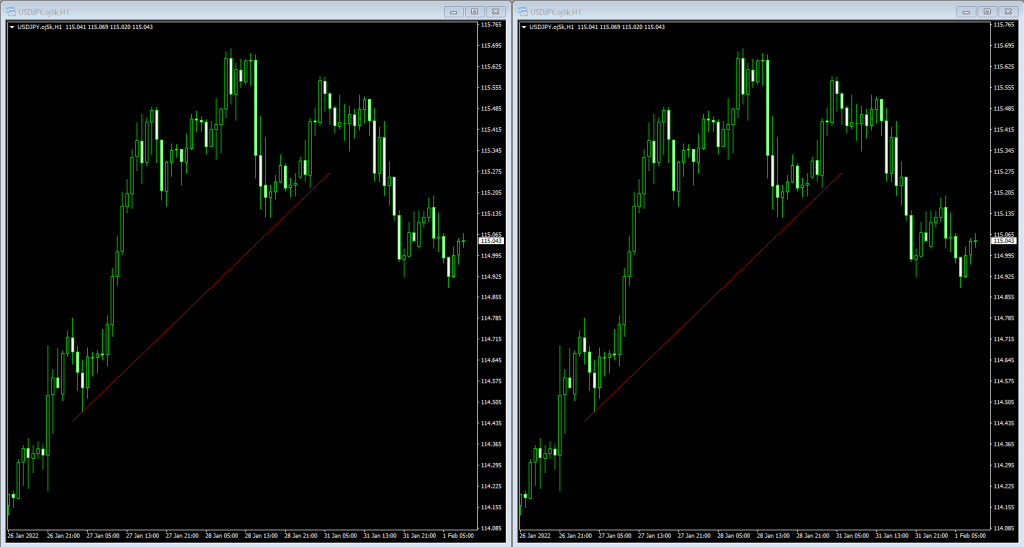
これでコンパイルを実行し、試しに二つのチャートにセットしてトレンドラインを引いてみましょう。片方のチャートにトレンドラインを引くと、もう片方のチャートにも同様のラインが引かれることが分かります。
トレンドラインの位置情報を同期
複数のチャートでトレンドラインを同期させて表示できました。しかし、このままの状態だと、トレンドラインを移動した場合に同期されません。そこで次は、元となるチャートのトレンドラインをドラッグした場合に、その位置情報を他のチャートにも同期させるようにします。
ここまでに作った、トレンドラインの新規作成時に同期させるコードを流用し、今度はトレンドラインを移動したときに同期させるコードを追記していきます。「CHARTEVENT_OBJECT_DRAG」として、オブジェクトの座標を変更する「ObjectMove」関数を使います。
if (id == CHARTEVENT_OBJECT_DRAG) {
   if (ObjectGetInteger(0, sparam, OBJPROP_TYPE) == OBJ_TREND) {
      datetime time0 = (datetime)ObjectGetInteger(0, sparam, OBJPROP_TIME, 0);
      datetime time1 = (datetime)ObjectGetInteger(0, sparam, OBJPROP_TIME, 1);
      double price0 = ObjectGetDouble(0, sparam, OBJPROP_PRICE, 0);
      double price1 = ObjectGetDouble(0, sparam, OBJPROP_PRICE, 1);

      long chart_id = ChartFirst();
      while (true) {
         if (chart_id != ChartID() && ChartSymbol(chart_id) == _Symbol) {
            ObjectMove(chart_id, sparam, 0, time0, price0);
            ObjectMove(chart_id, sparam, 1, time1, price1);
            ChartRedraw(chart_id);
         }
         chart_id = ChartNext(chart_id);
         if (chart_id < 0) break;
      }
   }
}
上記コードを追加してコンパイルすると、トレンドラインの位置の同期もできます。元となるチャートのトレンドラインをドラッグして移動させると、もう一方のチャートのトレンドラインも同じ位置に移動します。

トレンドラインの描画スタイルの変更や削除操作を同期
最後に、トレンドラインの色や太さ、線の種類などのスタイルが変更された場合の情報と、トレンドラインが削除された場合の情報を同期させます。まずスタイル関係が変更された場合の処理について、「CHARTEVENT_OBJECT_CHANGE」として次のように記述しましょう。トレンドラインの状態を設定するので「ObjectSetInteger」を使います。
if (id == CHARTEVENT_OBJECT_CHANGE) {
      if (ObjectGetInteger(0, sparam, OBJPROP_TYPE) == OBJ_TREND) {
         color clr = (color)ObjectGetInteger(0, sparam, OBJPROP_COLOR);
         ENUM_LINE_STYLE style = (ENUM_LINE_STYLE)ObjectGetInteger(0, sparam, OBJPROP_STYLE);
         int width = (int)ObjectGetInteger(0, sparam, OBJPROP_WIDTH);
         bool back = ObjectGetInteger(0, sparam, OBJPROP_BACK);
         bool ray = ObjectGetInteger(0, sparam, OBJPROP_RAY);

         long chart_id = ChartFirst();
         while (true) {
            if (chart_id != ChartID() && ChartSymbol(chart_id) == _Symbol) {
               ObjectSetInteger(chart_id, sparam, OBJPROP_COLOR, clr);
               ObjectSetInteger(chart_id, sparam, OBJPROP_STYLE, style);
               ObjectSetInteger(chart_id, sparam, OBJPROP_WIDTH, width);
               ObjectSetInteger(chart_id, sparam, OBJPROP_BACK, back);
               ObjectSetInteger(chart_id, sparam, OBJPROP_RAY, ray);
               ChartRedraw(chart_id);
            }
            chart_id = ChartNext(chart_id);
            if (chart_id < 0) break;
      }
   }
}
これでコンパイルし、元となるチャートの線の色を黄色に、線の種類を破線に変更すると、もう一方のトレンドラインも同様に切り替わることが分かります。

トレンドラインが削除された場合の情報の同期に関しては、「CHARTEVENT_OBJECT_DELETE」として次のように記述しましょう。二つめのif文の「ObjectGetInteger」を「StringFind」に変更し、トレンドラインを作ったときにできる「Trendline」という名称が名前に含まれていたら削除します(トレンドラインが削除されて「ObjectGetInteger」 では情報を取得することができないため、「StringFind」を利用した種別判定とします)。
if (id == CHARTEVENT_OBJECT_DELETE) {
   if (StringFind(sparam, "Trendline ") != -1) {
      long chart_id = ChartFirst();
      while (true) {
         if (chart_id != ChartID() && ChartSymbol(chart_id) == _Symbol) {
            ObjectDelete(chart_id, sparam);
            ChartRedraw(chart_id);
         }
         chart_id = ChartNext(chart_id);
         if (chart_id < 0) break;
      }
   }
}
これで完成です。コンパイルして元となるチャートのトレンドラインを削除すると、もう一方のトレンドラインも消えます。

ソースコード
今回、作成したソースコードは下記の通りです。
//+------------------------------------------------------------------+
//|                                                TrendlineSync.mq4 |
//|                        Copyright 2022, MetaQuotes Software Corp. |
//|                                             https://www.mql5.com |
//+------------------------------------------------------------------+
#property copyright "Copyright 2022, MetaQuotes Software Corp."
#property link      "https://www.mql5.com"
#property version   "1.00"
#property strict
#property indicator_chart_window
//+------------------------------------------------------------------+
//| Custom indicator initialization function                         |
//+------------------------------------------------------------------+
int OnInit()
{
//--- indicator buffers mapping

   ChartSetInteger(0, CHART_EVENT_OBJECT_CREATE, true);
   ChartSetInteger(0, CHART_EVENT_OBJECT_DELETE, true);
//---
   return(INIT_SUCCEEDED);
}
//+------------------------------------------------------------------+
//| Custom indicator iteration function                              |
//+------------------------------------------------------------------+
int OnCalculate(const int rates_total,
                const int prev_calculated,
                const datetime &time[],
                const double &open[],
                const double &high[],
                const double &low[],
                const double &close[],
                const long &tick_volume[],
                const long &volume[],
                const int &spread[])
  {
//---

//--- return value of prev_calculated for next call
   return(rates_total);
  }
//+------------------------------------------------------------------+
//| ChartEvent function                                              |
//+------------------------------------------------------------------+
void OnChartEvent(const int id,
                  const long &lparam,
                  const double &dparam,
                  const string &sparam)
  {
//---
   if (id == CHARTEVENT_OBJECT_CREATE) {
      if (ObjectGetInteger(0, sparam, OBJPROP_TYPE) == OBJ_TREND) {
         datetime time0 = (datetime)ObjectGetInteger(0, sparam, OBJPROP_TIME, 0);
         datetime time1 = (datetime)ObjectGetInteger(0, sparam, OBJPROP_TIME, 1);
         double price0 = ObjectGetDouble(0, sparam, OBJPROP_PRICE, 0);
         double price1 = ObjectGetDouble(0, sparam, OBJPROP_PRICE, 1);
         color clr = (color)ObjectGetInteger(0, sparam, OBJPROP_COLOR);
         ENUM_LINE_STYLE style = (ENUM_LINE_STYLE)ObjectGetInteger(0, sparam, OBJPROP_STYLE);
         int width = (int)ObjectGetInteger(0, sparam, OBJPROP_WIDTH);
         bool back = ObjectGetInteger(0, sparam, OBJPROP_BACK);
         bool ray = ObjectGetInteger(0, sparam, OBJPROP_RAY);

         long chart_id = ChartFirst();
         while (true) {
            if (chart_id != ChartID() && ChartSymbol(chart_id) == _Symbol) {
               if (ObjectFind(chart_id, sparam) == -1)
                  TrendCreate(chart_id, sparam, 0, time0, price0, time1, price1, clr, style, width, back, ray);
               ChartRedraw(chart_id);
            }
            chart_id = ChartNext(chart_id);
            if (chart_id < 0) break;
         }
      }
   }
   if (id == CHARTEVENT_OBJECT_DRAG) {
      if (ObjectGetInteger(0, sparam, OBJPROP_TYPE) == OBJ_TREND) {
         datetime time0 = (datetime)ObjectGetInteger(0, sparam, OBJPROP_TIME, 0);
         datetime time1 = (datetime)ObjectGetInteger(0, sparam, OBJPROP_TIME, 1);
         double price0 = ObjectGetDouble(0, sparam, OBJPROP_PRICE, 0);
         double price1 = ObjectGetDouble(0, sparam, OBJPROP_PRICE, 1);

         long chart_id = ChartFirst();
         while (true) {
            if (chart_id != ChartID() && ChartSymbol(chart_id) == _Symbol) {
               ObjectMove(chart_id, sparam, 0, time0, price0);
               ObjectMove(chart_id, sparam, 1, time1, price1);
               ChartRedraw(chart_id);
            }
            chart_id = ChartNext(chart_id);
            if (chart_id < 0) break;
         }
      }
   }
   if (id == CHARTEVENT_OBJECT_CHANGE) {
      if (ObjectGetInteger(0, sparam, OBJPROP_TYPE) == OBJ_TREND) {
         color clr = (color)ObjectGetInteger(0, sparam, OBJPROP_COLOR);
         ENUM_LINE_STYLE style = (ENUM_LINE_STYLE)ObjectGetInteger(0, sparam, OBJPROP_STYLE);
         int width = (int)ObjectGetInteger(0, sparam, OBJPROP_WIDTH);
         bool back = ObjectGetInteger(0, sparam, OBJPROP_BACK);
         bool ray = ObjectGetInteger(0, sparam, OBJPROP_RAY);

         long chart_id = ChartFirst();
         while (true) {
            if (chart_id != ChartID() && ChartSymbol(chart_id) == _Symbol) {
               ObjectSetInteger(chart_id, sparam, OBJPROP_COLOR, clr);
               ObjectSetInteger(chart_id, sparam, OBJPROP_STYLE, style);
               ObjectSetInteger(chart_id, sparam, OBJPROP_WIDTH, width);
               ObjectSetInteger(chart_id, sparam, OBJPROP_BACK, back);
               ObjectSetInteger(chart_id, sparam, OBJPROP_RAY, ray);
               ChartRedraw(chart_id);
            }
            chart_id = ChartNext(chart_id);
            if (chart_id < 0) break;
         }
      }
   }
   if (id == CHARTEVENT_OBJECT_DELETE) {
      if (StringFind(sparam, "Trendline ") != -1) {

         long chart_id = ChartFirst();
         while (true) {
            if (chart_id != ChartID() && ChartSymbol(chart_id) == _Symbol) {
               ObjectDelete(chart_id, sparam);
               ChartRedraw(chart_id);
            }
            chart_id = ChartNext(chart_id);
            if (chart_id < 0) break;
         }
      }
   }
}
//+------------------------------------------------------------------+
//| Create a trend line by the given coordinates                     |
//+------------------------------------------------------------------+
bool TrendCreate(const long            chart_ID = 0,      // chart's ID
                 const string          name = "TrendLine", // line name
                 const int             sub_window = 0,    // subwindow index
                 datetime              time1 = 0,         // first point time
                 double                price1 = 0,        // first point price
                 datetime              time2 = 0,         // second point time
                 double                price2 = 0,        // second point price
                 const color           clr = clrRed,      // line color
                 const ENUM_LINE_STYLE style = STYLE_SOLID, // line style
                 const int             width = 1,         // line width
                 const bool            back = false,      // in the background
                 const bool            ray = false, // line's continuation to the right
                 const bool            hidden = false,     // hidden in the object list
                 const long            z_order = 0)       // priority for mouse click
{
//--- create a trend line by the given coordinates
   if(!ObjectCreate(chart_ID, name, OBJ_TREND, sub_window, time1, price1, time2, price2)) {
      return(false);
   }
//--- set line color
   ObjectSetInteger(chart_ID, name, OBJPROP_COLOR, clr);
//--- set line display style
   ObjectSetInteger(chart_ID, name, OBJPROP_STYLE, style);
//--- set line width
   ObjectSetInteger(chart_ID, name, OBJPROP_WIDTH, width);
//--- display in the foreground (false) or background (true)
   ObjectSetInteger(chart_ID, name, OBJPROP_BACK, back);
//--- enable (true) or disable (false) the mode of moving the line by mouse
//--- when creating a graphical object using ObjectCreate function, the object cannot be
//--- highlighted and moved by default. Inside this method, selection parameter
//--- is true by default making it possible to highlight and move the object
//--- enable (true) or disable (false) the mode of continuation of the line's display to the right
   ObjectSetInteger(chart_ID, name, OBJPROP_RAY, ray);
//--- hide (true) or display (false) graphical object name in the object list
   ObjectSetInteger(chart_ID, name, OBJPROP_HIDDEN, hidden);
//--- set the priority for receiving the event of a mouse click in the chart
   ObjectSetInteger(chart_ID, name, OBJPROP_ZORDER, z_order);
//--- successful execution
   return(true);
}
//+------------------------------------------------------------------+
本記事の監修者・HT FX
2013年にFXを開始し、その後専業トレーダーへ。2014年からMT4/MT5のカスタムインジケーターの開発に取り組む。ブログでは100本を超えるインジケーターを無料公開。投資スタイルは自作の秒足インジケーターを利用したスキャルピング。
EA(自動売買)を学びたい方へオススメコンテンツ

OANDAではEA(自動売買)を稼働するプラットフォームMT4/MT5の基本的な使い方について、画像や動画付きで詳しく解説しています。MT4/MT5のインストールからEAの設定方法までを詳しく解説しているので、初心者の方でもスムーズにEA運用を始めることが可能です。またOANDAの口座をお持ちであれば、独自開発したオリジナルインジケーターを無料で利用することもできます。EA運用をお考えであれば、ぜひ口座開設をご検討ください。
本ホームページに掲載されている事項は、投資判断の参考となる情報の提供を目的としたものであり、投資の勧誘を目的としたものではありません。投資方針、投資タイミング等は、ご自身の責任において判断してください。本サービスの情報に基づいて行った取引のいかなる損失についても、当社は一切の責を負いかねますのでご了承ください。また、当社は、当該情報の正確性および完全性を保証または約束するものでなく、今後、予告なしに内容を変更または廃止する場合があります。なお、当該情報の欠落・誤謬等につきましてもその責を負いかねますのでご了承ください。