気配値表示にある複数通貨ペアの情報でグラフを描画する方法
気配値表示の通貨ペア名を上から順に取得
この記事では、気配値表示にある複数通貨ペアに対して、処理を実行する方法を解説します。まずは気配値表示の上から順番に、通貨ペアを認識させて表示する方法についてです。
ファイルの新規作成で「カスタムインディケータ」を選択後、ファイル名を「MultiSymbol_demo」とします。「カスタムインディケータのイベントハンドラ」の画面では、「OnTimer」「OnChartEvent」のどちらにもチェックを入れずに次へ進み、「完了」をクリックすれば、ひな形の完成です。

最初に、OnCalculate内でSymbolName関数を使って気配値表示にある通貨ペア名を上から順に取得します。SymbolName関数の括弧内の二つ目を「true」にすることで、気配値表示のリストから通貨ペア名を取得可能です。通貨ペア名を取得できなかった場合はfor文を抜けたいので、if文でbreak処理を行うようにしておきましょう。
for(int i = 0; i < 1000; i++) {
   string symbol = SymbolName(i, true);
   if (symbol == NULL) break;
}
取得した通貨ペア名をLabelオブジェクトで表示
続いて、取得した通貨ペア名をLabelオブジェクトで表示させます。Labelオブジェクトのサンプルコードは、MQL4リファレンスからコピーして使いましょう。
MQL4リファレンスの目次にある「Constants, Enumerations and Structures」→「Objects Constants」→「Object Types」をクリックするとオブジェクトの一覧が表示されます。その中から「OBJ_LABEL」を選択し、あらかじめ用意されている「Create a text label」のコードをコピーしてファイル下部に貼り付けます。
まず、貼り付けたコードのif文の中にある「Print(__FUNCTION__,」と「: failed to create text label! Error code = ",GetLastError());」の2行は不要なので削除します。
オブジェクトの基準位置については右中央としたいので、「// anchor type」のところを「anchor = ANCHOR_LEFT_UPPER」から「anchor = ANCHOR_RIGHT」に変えます。
また、カラーのところを「clrRed」から「clrWhite」に、フォントのところを「font = "Arial"」から「font = "Arial Bold"」に変更して白の太字にしましょう。
その他の項目は、そのままとします。
//+------------------------------------------------------------------+
//| Create a text label                                              |
//+------------------------------------------------------------------+
bool LabelCreate(const long              chart_ID=0,               // chart's ID
                 const string            name="Label",             // label name
                 const int               sub_window=0,             // subwindow index
                 const int               x=0,                      // X coordinate
                 const int               y=0,                      // Y coordinate
                 const ENUM_BASE_CORNER  corner=CORNER_LEFT_UPPER, // chart corner for anchoring
                 const string            text="Label",             // text
                 const string            font="Arial Bold",        // font
                 const int               font_size=10,             // font size
                 const color             clr=clrWhite,             // color
                 const double            angle=0.0,                // text slope
                 const ENUM_ANCHOR_POINT anchor=ANCHOR_RIGHT,      // anchor type
                 const bool              back=false,               // in the background
                 const bool              selection=false,          // highlight to move
                 const bool              hidden=true,              // hidden in the object list
                 const long              z_order=0)                // priority for mouse click
  {
//--- reset the error value
   ResetLastError();
//--- create a text label
   if(!ObjectCreate(chart_ID,name,OBJ_LABEL,sub_window,0,0))
   {
      return(false);
   }
//--- set label coordinates
   ObjectSetInteger(chart_ID,name,OBJPROP_XDISTANCE,x);
   ObjectSetInteger(chart_ID,name,OBJPROP_YDISTANCE,y);
//--- set the chart's corner, relative to which point coordinates are defined
   ObjectSetInteger(chart_ID,name,OBJPROP_CORNER,corner);
//--- set the text
   ObjectSetString(chart_ID,name,OBJPROP_TEXT,text);
//--- set text font
   ObjectSetString(chart_ID,name,OBJPROP_FONT,font);
//--- set font size
   ObjectSetInteger(chart_ID,name,OBJPROP_FONTSIZE,font_size);
//--- set the slope angle of the text
   ObjectSetDouble(chart_ID,name,OBJPROP_ANGLE,angle);
//--- set anchor type
   ObjectSetInteger(chart_ID,name,OBJPROP_ANCHOR,anchor);
//--- set color
   ObjectSetInteger(chart_ID,name,OBJPROP_COLOR,clr);
//--- display in the foreground (false) or background (true)
   ObjectSetInteger(chart_ID,name,OBJPROP_BACK,back);
//--- enable (true) or disable (false) the mode of moving the label by mouse
   ObjectSetInteger(chart_ID,name,OBJPROP_SELECTABLE,selection);
   ObjectSetInteger(chart_ID,name,OBJPROP_SELECTED,selection);
//--- hide (true) or display (false) graphical object name in the object list
   ObjectSetInteger(chart_ID,name,OBJPROP_HIDDEN,hidden);
//--- set the priority for receiving the event of a mouse click in the chart
   ObjectSetInteger(chart_ID,name,OBJPROP_ZORDER,z_order);
//--- successful execution
   return(true);
  }
//+------------------------------------------------------------------+
そしてこのLabelCreateの処理をOnCalculate内のif文の下に書き入れます。パラメーターの指定で、X位置は「90」、Y位置は16ピクセル間隔にしたいので「20 + i * 16」、基準位置は左上にしたいので「CORNER_LEFT_UPPER」、テキストは「symbol」とします。
これ以降は初期パラメーターで問題ないので省略します。
LabelCreate(0, "Symbol" + IntegerToString(i), 0, 90, 20 + i * 16, CORNER_LEFT_UPPER, symbol);
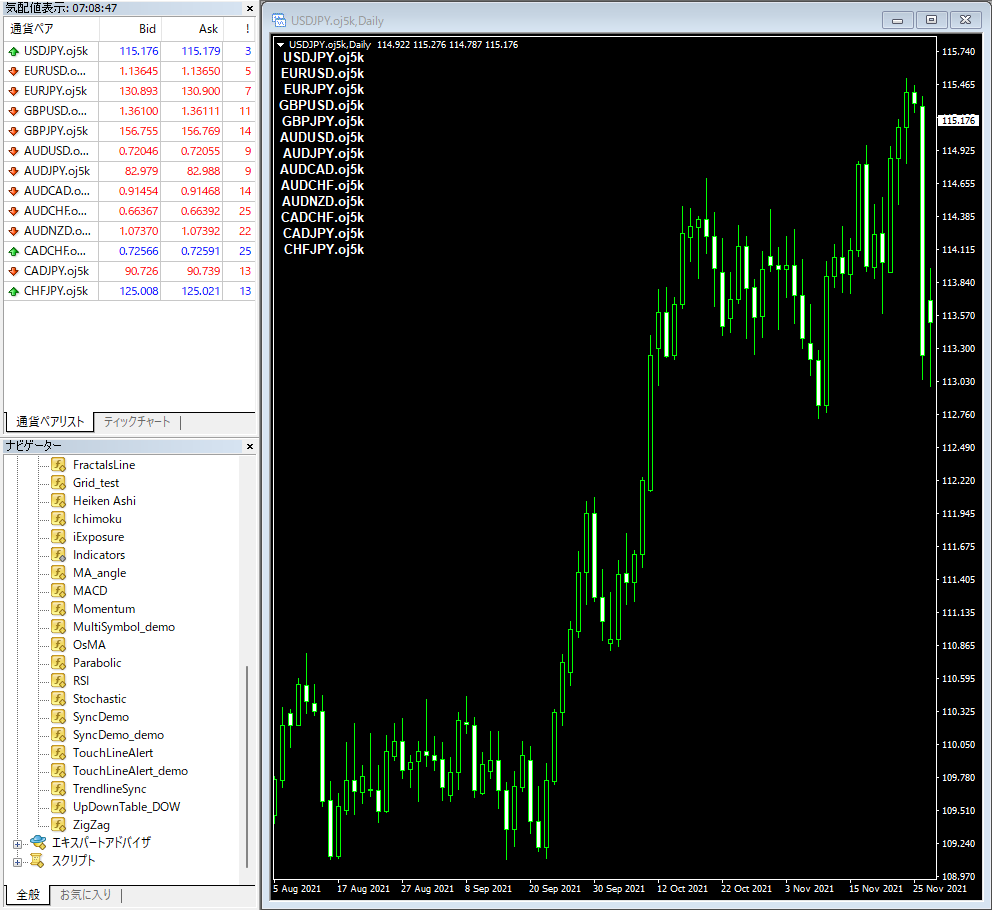
これでコンパイルしてチャートにセットすると、チャート左上に、気配値表示にある通貨ペア名が上から順に表示されることが分かります。
通貨ペア名の隣に値動きの比率を表示
次に、通貨ペアごとに値動き量を計算し、棒グラフで表示するツールを作ります。
まずは、指定した通貨ペアのローソク足の終値を取得するiClose関数を使い、最新の足の一つ前の足を基準として、現在の足の終値がどれだけ動いたかを計算します。「LabelCreate(0, "Symbol" + IntegerToString(i), 0, 90, 20 + i * 16, CORNER_LEFT_UPPER, symbol);」の下に、次のコードを追記しましょう。
割り算の際、割る数字が0だとエラーが出てしまうので、その場合は計算処理を実行しないようにcontinueを使って繰り返し処理をスキップさせます。
double closePre = iClose(symbol, 0, 1);
if (closePre == 0) continue;
double ratio = (iClose(symbol, 0, 0) - closePre) / closePre * 100;
ここで、オブジェクトを一括で消したりできるように、接頭辞を設定しておきます。ファイル上部のプロパティ「property indicator_chart_window」の下に「#define」を使って「PREFIX」を定義します。
#define PREFIX MQLInfoString(MQL_PROGRAM_NAME) + "_"
そして「Custom indicator initialization function」の下に「Custom indicator deinit function」を設けて、ObjectsDeleteAll関数でオブジェクトを毎回削除するようにします。
void OnDeinit(const int reason)
{
   ObjectsDeleteAll(0, PREFIX);
}
この「PREFIX」は、通貨ペア名を表示するLabelCreateの括弧内の名前のところにも加える必要があります。そうすることで、「PREFIX」という文字が入ったオブジェクトは毎回削除されます。
LabelCreate(0, PREFIX + "Symbol" + IntegerToString(i), 0, 90, 20 + i * 16, CORNER_LEFT_UPPER, symbol);
ここまでできたら、「double ratio = (iClose(symbol, 0, 0) - closePre) / closePre * 100;」の下に、計算した結果を数値として表示するコードを加えましょう。通貨ペア名を表示するLabelCreateを流用して、次のように書き換えます。
LabelCreate(0, PREFIX + "Data" + IntegerToString(i), 0, 230, 20 + i * 16, CORNER_LEFT_UPPER, (string)ratio);
これでコンパイルしてチャートを確認すると、通貨ペア名の隣に計算結果が表示されているのが分かります。

RECTANGLE LABELで棒グラフを表現
計算で求めた値動きの比率を、今度は棒グラフで表示するようにします。
値動き比率の表示はもう必要ないので、「LabelCreate(0, PREFIX + "Data" + IntegerToString(i), 0, 230, 20 + i * 16, CORNER_LEFT_UPPER, (string)ratio);」のところは頭に「//」をつけてコメント扱いとしましょう。
そして、その下で棒グラフの長さを定義します。数値を絶対値にするMathAbsという関数を利用して、負の値は正の値に変換します。求めた値動きの比率は小さい値なので100倍にして、それを整数型に変換するのがポイントです。
棒グラフの色に関しては、比率が正の値のときは赤、負の値のときは青としておきます。
//      LabelCreate(0, PREFIX + "Data" + IntegerToString(i), 0, 200, 20 + i * 16, CORNER_LEFT_UPPER, (string)ratio);
int len = (int)MathAbs(ratio * 100);
color clr = ratio > 0 ? clrRed : clrDodgerBlue;
今回、棒グラフとして利用するのは「RECTANGLE LABEL」です。これはXY座標で指定する長方形のオブジェクトです。
サンプルコードは、MQL4リファレンスからコピーして使いましょう。MQL4リファレンスの目次にある「Constants, Enumerations and Structures」→「Objects Constants」→「Object Types」をクリックするとオブジェクトの一覧が表示されます。その中から「OBJ_RECTANGLE_LABEL」を選択し、あらかじめ用意されている「Create rectangle label」のコードをコピーしてファイル下部に貼り付けます。
まず、貼り付けたコードのif文の中にある「Print(__FUNCTION__,」と「": failed to create a rectangle label! Error code = ",GetLastError());」の2行は不要なので削除し、ここでは枠の色を白にしたいので「// flat border color (Flat)」の「clr = clrRed」を「clr = clrWhite」に変更します。
また、このままでは値が変わっても棒グラフの横幅が変化してくれないので、横幅だけは変化するようにif文の下に「ObjectSetInteger(chart_ID, name, OBJPROP_WIDTH, line_width);」を追記します。
//+------------------------------------------------------------------+
//| Create rectangle label                                           |
//+------------------------------------------------------------------+
bool RectLabelCreate(const long             chart_ID=0,               // chart's ID
                     const string           name="RectLabel",         // label name
                     const int              sub_window=0,             // subwindow index
                     const int              x=0,                      // X coordinate
                     const int              y=0,                      // Y coordinate
                     const int              width=50,                 // width
                     const int              height=18,                // height
                     const color            back_clr=C'236,233,216',  // background color
                     const ENUM_BORDER_TYPE border=BORDER_SUNKEN,     // border type
                     const ENUM_BASE_CORNER corner=CORNER_LEFT_UPPER, // chart corner for anchoring
                     const color            clr=clrWhite,               // flat border color (Flat)
                     const ENUM_LINE_STYLE  style=STYLE_SOLID,        // flat border style
                     const int              line_width=1,             // flat border width
                     const bool             back=false,               // in the background
                     const bool             selection=false,          // highlight to move
                     const bool             hidden=true,              // hidden in the object list
                     const long             z_order=0)                // priority for mouse click
  {
//--- reset the error value
   ResetLastError();
//--- create a rectangle label
   if(!ObjectCreate(chart_ID,name,OBJ_RECTANGLE_LABEL,sub_window,0,0)) {
      ObjectSetInteger(chart_ID, name, OBJPROP_WIDTH, line_width);
      return(false);
   }
//--- set label coordinates
   ObjectSetInteger(chart_ID,name,OBJPROP_XDISTANCE,x);
   ObjectSetInteger(chart_ID,name,OBJPROP_YDISTANCE,y);
//--- set label size
   ObjectSetInteger(chart_ID,name,OBJPROP_XSIZE,width);
   ObjectSetInteger(chart_ID,name,OBJPROP_YSIZE,height);
//--- set background color
   ObjectSetInteger(chart_ID,name,OBJPROP_BGCOLOR,back_clr);
//--- set border type
   ObjectSetInteger(chart_ID,name,OBJPROP_BORDER_TYPE,border);
//--- set the chart's corner, relative to which point coordinates are defined
   ObjectSetInteger(chart_ID,name,OBJPROP_CORNER,corner);
//--- set flat border color (in Flat mode)
   ObjectSetInteger(chart_ID,name,OBJPROP_COLOR,clr);
//--- set flat border line style
   ObjectSetInteger(chart_ID,name,OBJPROP_STYLE,style);
//--- set flat border width
   ObjectSetInteger(chart_ID,name,OBJPROP_WIDTH,line_width);
//--- display in the foreground (false) or background (true)
   ObjectSetInteger(chart_ID,name,OBJPROP_BACK,back);
//--- enable (true) or disable (false) the mode of moving the label by mouse
   ObjectSetInteger(chart_ID,name,OBJPROP_SELECTABLE,selection);
   ObjectSetInteger(chart_ID,name,OBJPROP_SELECTED,selection);
//--- hide (true) or display (false) graphical object name in the object list
   ObjectSetInteger(chart_ID,name,OBJPROP_HIDDEN,hidden);
//--- set the priority for receiving the event of a mouse click in the chart
   ObjectSetInteger(chart_ID,name,OBJPROP_ZORDER,z_order);
//--- successful execution
   return(true);
  }
これでOBJ_RECTANGLE_LABELの設定は完了です。
棒グラフを作成してチャートに描画
続いて、それを利用して棒グラフを作っていきます。
OnCalculate関数の配下で、設定したRectLabelCreateを実行させます。オブジェクト名称は「Graph」、X位置は「95」、Y位置は「14 + i * 16」、幅は「len」、高さは「12」、色は陽線なら「赤」、陰線なら「青」とします。
RectLabelCreate(0, PREFIX + "Graph" + IntegerToString(i), 0, 95, 14 + i * 16, len, 12, clr);
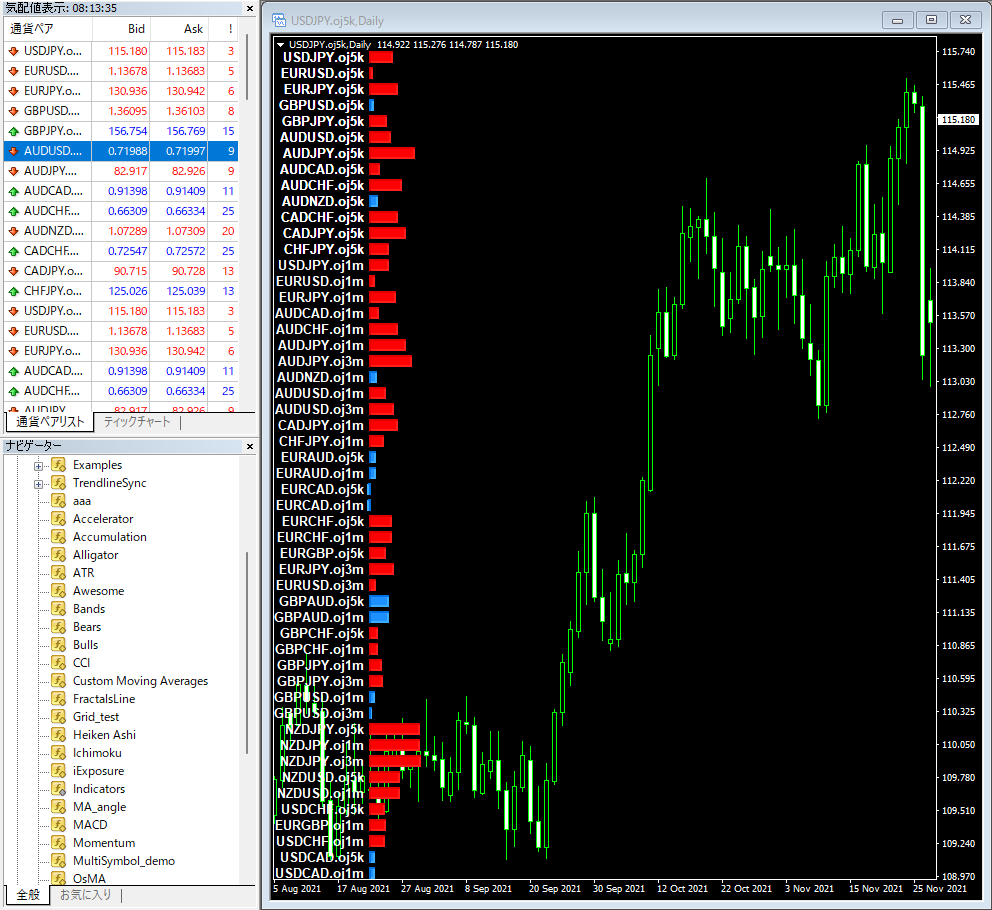
これでコンパイルすると、値動きの比率が数値から棒グラフに変わったことが分かります。

ツールチップに値動き率を表示する
現状、チャートに表示されるのは気配値表示にある通貨ペアのみの情報ですが、気配値表示上で右クリックして「全て表示」を選択すると、表示できる全ての通貨ペアの名称と値動き率の棒グラフが反映されます。
読み込んでいないデータについては、棒グラフを表示するまでに時間がかかる場合がありますが、徐々に表示されます。
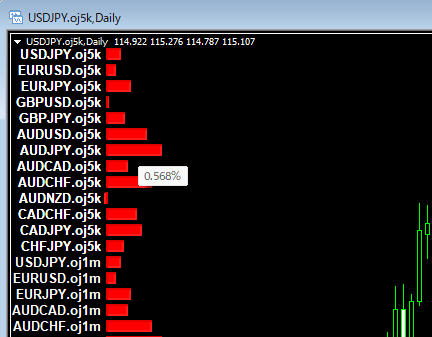
なお、オブジェクトにマウスカーソルを重ねると出てくるツールチップに値動き率の数値を表示させることが可能です。今回は値動き率を小数点以下3桁まで表示し、数値の後ろに「%」を付けるようにしてみましょう。OnCalculate関数内の「color clr = ratio > 0 ? clrRed : clrDodgerBlue;」の下で「tt」を定義し、RectLabelCreateのパラメーターとして括弧内の最後にその「tt」を追加します。
RectLabelCreate(0, PREFIX + "Graph" + IntegerToString(i), 0, 95, 14 + i * 16, len, 12, clr);
そして「Create rectangle label」の「// background color」の下に、「// tooltip」として次の式を加えます。「\n」は初期値無しという意味です。
const string tt = "\n", // tooltip
また「ObjectSetInteger(chart_ID, name, OBJPROP_ZORDER, z_order);」の下に、「ObjectSetString」を用いた次のコードも追記しましょう。
ObjectSetString(chart_ID, name, OBJPROP_TOOLTIP, tt);
これでコンパイルすると、それぞれの値動き率が数字でポップアップ表示されるのが確認できます。
ソースコード
今回、作成したソースコードは下記の通りです。
//+------------------------------------------------------------------+
//|                                             MultiSymbol_demo.mq4 |
//|                        Copyright 2022, MetaQuotes Software Corp. |
//|                                             https://www.mql5.com |
//+------------------------------------------------------------------+
#property copyright "Copyright 2022, MetaQuotes Software Corp."
#property link      "https://www.mql5.com"
#property version   "1.00"
#property strict
#property indicator_chart_window
#define PREFIX MQLInfoString(MQL_PROGRAM_NAME) + "_"
//+------------------------------------------------------------------+
//| Custom indicator initialization function                         |
//+------------------------------------------------------------------+
int OnInit()
  {
//--- indicator buffers mapping

//---
   return(INIT_SUCCEEDED);
  }
//+------------------------------------------------------------------+
//| Custom indicator deinit function                         |
//+------------------------------------------------------------------+
void OnDeinit(const int reason)
{
   ObjectsDeleteAll(0, PREFIX);
}
//+------------------------------------------------------------------+
//| Custom indicator iteration function                              |
//+------------------------------------------------------------------+
int OnCalculate(const int rates_total,
                const int prev_calculated,
                const datetime &time[],
                const double &open[],
                const double &high[],
                const double &low[],
                const double &close[],
                const long &tick_volume[],
                const long &volume[],
                const int &spread[])
{
//---
   for(int i = 0; i < 1000; i++) {
      string symbol = SymbolName(i, true);
      if (symbol == NULL) break;
      LabelCreate(0, PREFIX + "Symbol" + IntegerToString(i), 0, 90, 20 + i * 16, CORNER_LEFT_UPPER, symbol);

      double closePre = iClose(symbol, 0, 1);
      if (closePre == 0) continue;
      double ratio = (iClose(symbol, 0, 0) - closePre) / closePre * 100;

//      LabelCreate(0, PREFIX + "Data" + IntegerToString(i), 0, 230, 20 + i * 16, CORNER_LEFT_UPPER, (string)ratio);

      int len = (int)MathAbs(ratio * 100);
      color clr = ratio > 0 ? clrRed : clrDodgerBlue;
      string tt = DoubleToString(ratio, 3) + "%";

      RectLabelCreate(0, PREFIX + "Graph" + IntegerToString(i), 0, 95, 14 + i * 16, len, 12, clr, tt);

   }
//--- return value of prev_calculated for next call
   return(rates_total);
  }
//+------------------------------------------------------------------+
//| Create a text label                                              |
//+------------------------------------------------------------------+
bool LabelCreate(const long              chart_ID=0,               // chart's ID
                 const string            name="Label",             // label name
                 const int               sub_window=0,             // subwindow index
                 const int               x=0,                      // X coordinate
                 const int               y=0,                      // Y coordinate
                 const ENUM_BASE_CORNER  corner=CORNER_LEFT_UPPER, // chart corner for anchoring
                 const string            text="Label",             // text
                 const string            font="Arial Bold",        // font
                 const int               font_size=10,             // font size
                 const color             clr=clrWhite,             // color
                 const double            angle=0.0,                // text slope
                 const ENUM_ANCHOR_POINT anchor=ANCHOR_RIGHT,      // anchor type
                 const bool              back=false,               // in the background
                 const bool              selection=false,          // highlight to move
                 const bool              hidden=true,              // hidden in the object list
                 const long              z_order=0)                // priority for mouse click
  {
//--- reset the error value
   ResetLastError();
//--- create a text label
   if(!ObjectCreate(chart_ID,name,OBJ_LABEL,sub_window,0,0)){
   return(false);
   }
//--- set label coordinates
   ObjectSetInteger(chart_ID,name,OBJPROP_XDISTANCE,x);
   ObjectSetInteger(chart_ID,name,OBJPROP_YDISTANCE,y);
//--- set the chart's corner, relative to which point coordinates are defined
   ObjectSetInteger(chart_ID,name,OBJPROP_CORNER,corner);
//--- set the text
   ObjectSetString(chart_ID,name,OBJPROP_TEXT,text);
//--- set text font
   ObjectSetString(chart_ID,name,OBJPROP_FONT,font);
//--- set font size
   ObjectSetInteger(chart_ID,name,OBJPROP_FONTSIZE,font_size);
//--- set the slope angle of the text
   ObjectSetDouble(chart_ID,name,OBJPROP_ANGLE,angle);
//--- set anchor type
   ObjectSetInteger(chart_ID,name,OBJPROP_ANCHOR,anchor);
//--- set color
   ObjectSetInteger(chart_ID,name,OBJPROP_COLOR,clr);
//--- display in the foreground (false) or background (true)
   ObjectSetInteger(chart_ID,name,OBJPROP_BACK,back);
//--- enable (true) or disable (false) the mode of moving the label by mouse
   ObjectSetInteger(chart_ID,name,OBJPROP_SELECTABLE,selection);
   ObjectSetInteger(chart_ID,name,OBJPROP_SELECTED,selection);
//--- hide (true) or display (false) graphical object name in the object list
   ObjectSetInteger(chart_ID,name,OBJPROP_HIDDEN,hidden);
//--- set the priority for receiving the event of a mouse click in the chart
   ObjectSetInteger(chart_ID,name,OBJPROP_ZORDER,z_order);
//--- successful execution
   return(true);
  }
//+------------------------------------------------------------------+
//| Create rectangle label                                           |
//+------------------------------------------------------------------+
bool RectLabelCreate(const long             chart_ID=0,               // chart's ID
                     const string           name="RectLabel",         // label name
                     const int              sub_window=0,             // subwindow index
                     const int              x=0,                      // X coordinate
                     const int              y=0,                      // Y coordinate
                     const int              width=50,                 // width
                     const int              height=18,                // height
                     const color            back_clr=C'236,233,216',  // background color
                     const string           tt = "\n",                // tooltip
                     const ENUM_BORDER_TYPE border=BORDER_SUNKEN,     // border type
                     const ENUM_BASE_CORNER corner=CORNER_LEFT_UPPER, // chart corner for anchoring
                     const color            clr=clrWhite,               // flat border color (Flat)
                     const ENUM_LINE_STYLE  style=STYLE_SOLID,        // flat border style
                     const int              line_width=1,             // flat border width
                     const bool             back=false,               // in the background
                     const bool             selection=false,          // highlight to move
                     const bool             hidden=true,              // hidden in the object list
                     const long             z_order=0)                // priority for mouse click
  {
//--- reset the error value
   ResetLastError();
//--- create a rectangle label
   if(!ObjectCreate(chart_ID,name,OBJ_RECTANGLE_LABEL,sub_window,0,0)) {
      ObjectSetInteger(chart_ID, name, OBJPROP_WIDTH, line_width);
      return(false);
   }
//--- set label coordinates
   ObjectSetInteger(chart_ID,name,OBJPROP_XDISTANCE,x);
   ObjectSetInteger(chart_ID,name,OBJPROP_YDISTANCE,y);
//--- set label size
   ObjectSetInteger(chart_ID,name,OBJPROP_XSIZE,width);
   ObjectSetInteger(chart_ID,name,OBJPROP_YSIZE,height);
//--- set background color
   ObjectSetInteger(chart_ID,name,OBJPROP_BGCOLOR,back_clr);
//--- set border type
   ObjectSetInteger(chart_ID,name,OBJPROP_BORDER_TYPE,border);
//--- set the chart's corner, relative to which point coordinates are defined
   ObjectSetInteger(chart_ID,name,OBJPROP_CORNER,corner);
//--- set flat border color (in Flat mode)
   ObjectSetInteger(chart_ID,name,OBJPROP_COLOR,clr);
//--- set flat border line style
   ObjectSetInteger(chart_ID,name,OBJPROP_STYLE,style);
//--- set flat border width
   ObjectSetInteger(chart_ID,name,OBJPROP_WIDTH,line_width);
//--- display in the foreground (false) or background (true)
   ObjectSetInteger(chart_ID,name,OBJPROP_BACK,back);
//--- enable (true) or disable (false) the mode of moving the label by mouse
   ObjectSetInteger(chart_ID,name,OBJPROP_SELECTABLE,selection);
   ObjectSetInteger(chart_ID,name,OBJPROP_SELECTED,selection);
//--- hide (true) or display (false) graphical object name in the object list
   ObjectSetInteger(chart_ID,name,OBJPROP_HIDDEN,hidden);
//--- set the priority for receiving the event of a mouse click in the chart
   ObjectSetInteger(chart_ID,name,OBJPROP_ZORDER,z_order);
   ObjectSetString(chart_ID, name, OBJPROP_TOOLTIP, tt);
//--- successful execution
   return(true);
  }
本記事の監修者・HT FX
2013年にFXを開始し、その後専業トレーダーへ。2014年からMT4/MT5のカスタムインジケーターの開発に取り組む。ブログでは100本を超えるインジケーターを無料公開。投資スタイルは自作の秒足インジケーターを利用したスキャルピング。
EA(自動売買)を学びたい方へオススメコンテンツ

OANDAではEA(自動売買)を稼働するプラットフォームMT4/MT5の基本的な使い方について、画像や動画付きで詳しく解説しています。MT4/MT5のインストールからEAの設定方法までを詳しく解説しているので、初心者の方でもスムーズにEA運用を始めることが可能です。またOANDAの口座をお持ちであれば、独自開発したオリジナルインジケーターを無料で利用することもできます。EA運用をお考えであれば、ぜひ口座開設をご検討ください。
本ホームページに掲載されている事項は、投資判断の参考となる情報の提供を目的としたものであり、投資の勧誘を目的としたものではありません。投資方針、投資タイミング等は、ご自身の責任において判断してください。本サービスの情報に基づいて行った取引のいかなる損失についても、当社は一切の責を負いかねますのでご了承ください。また、当社は、当該情報の正確性および完全性を保証または約束するものでなく、今後、予告なしに内容を変更または廃止する場合があります。なお、当該情報の欠落・誤謬等につきましてもその責を負いかねますのでご了承ください。